The understanding of data is now vital is the success of any earth business. So why should it be any different to Asgardia.
By visualising data, we can get a better understanding of what is happening in the world around us. We can choose to use open data ...


Hi Asgardians! I am very excited to be a small part of such a great vision. I look forward to doing more to progress this new nation. Thank you for allowing me to be a citizen.


Hi, Everyone! My name is Marcin. I am 42 years old, I'm living in London and I'm very happy I can be parts of this project, wich really is future for mankind!
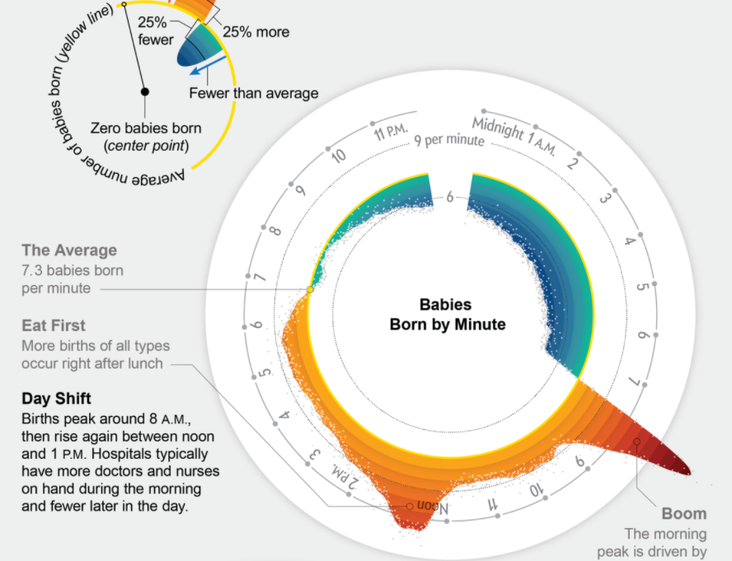
It's an interesting question! And what do you think the answer is? It's amazing at what data can tell us, especially when raw open data is visualised. In this example, the date and time of births are analysed and is presented in a way that it can be easily ...
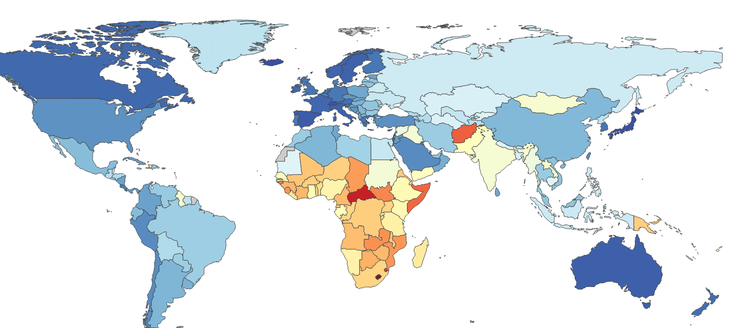
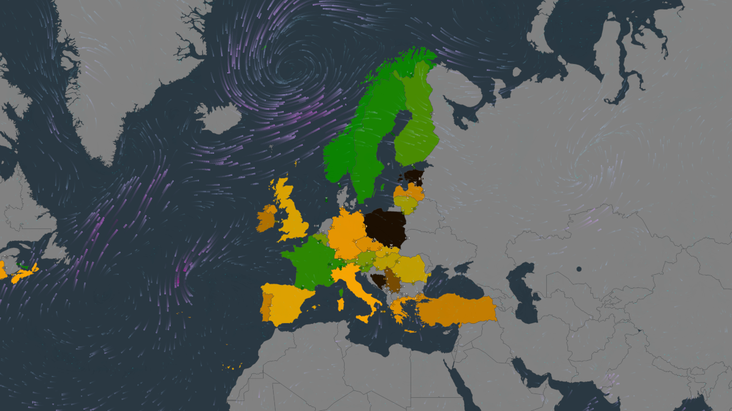
When data is visualised, we get to see a clear picture very quickly! This visualisation shows the life expectancy (LE) around the world and immediately, you can see which countries have a low LE. But how does this help us? How can this be used in Asgardia? When Asgardia ...
DURING THESE TIMES OF UNCERTAINTY ON EARTH WE HAVE BEEN GIVEN AN OPPORTUNITY TO PULL TOGETHER IN SPACE. LET US GRAB THAT OPPORTUNITY WITH ALL WE HAVE AND BUILD A BETTER FUTURE FOR THE HUMAN RACE.

"In the beginning there is no big difference between the coward and the courageous person. Both have fear. The difference is, the coward listens to his fears and follows them. The courageous person puts them aside and goes ahead. The fears are there, he knows them, but the courageous ...

As a 17 year old currently residing in the United Kingdom, i am yet unavailable to run as a local leader for the UK area or any positions of power. Until the time where i feel like i am legally and emotionally ready to run for these positions, i ...
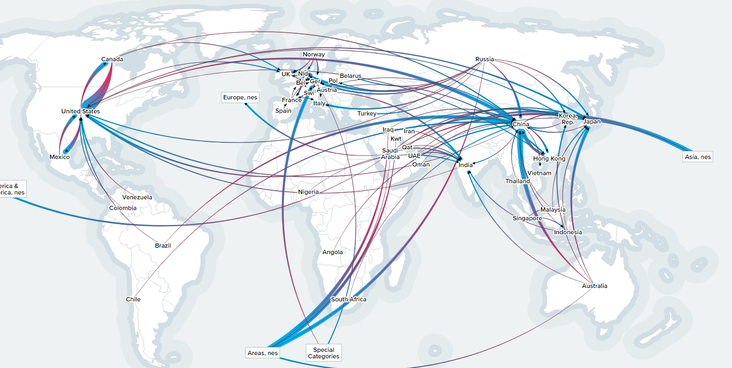
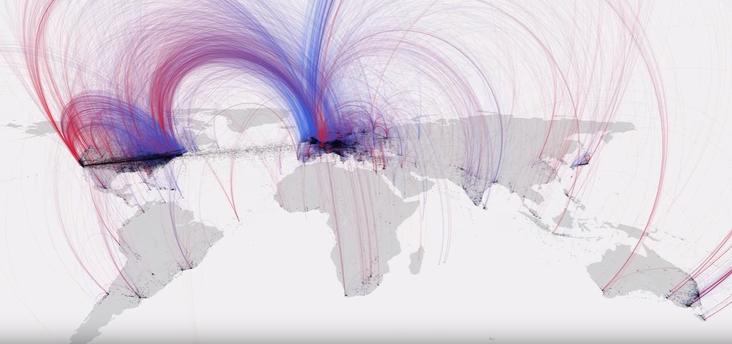
It's amazing what insights can immediately be seen when data is visualised. Have a look at this interactive map of word trade data, where you are able to dive into the different relations between the countries. Although this is data is from 2015, imagine having an up-to-date map with ...

The visualisation of data helps transform raw data into understandable information. This a great example of looking at a data set, in this case the 2017 UK elections, and being able to quickly answer interesting questions.
CLICK HERE to see the breakdown of ...
This is a beautiful example of using data to highlight conditions, help identify problems and gives us the ability to make informed decisions! I believe that the responsible and transparent use of data will benefit Asgardia greatly.
CLICK HERE to view a live ...

Hello All,
I'm a simple being, with such high hopes from humanity. My mentor is a fictional character, Master Yoda, who changed my life and gave me purpose of seeing the life better. One man can make a difference, but all together we are the answer. I ...


this is Ruby and me out for the day in Hastings and she is completely out of it :)

Please consider my application. Since I have joined, I have also enlisted 2 friends to join the movement.
Kind regards,
Nick